


NAVIGATION
Route navigation with real-time flight tracking
The pilot flies an optimized route built from your pipeline or electric transmission line data. The aircraft's position and coverage are tracked during the flight and recorded for review afterward.
Best for operators who want efficient routing and a clear record of what was covered, without modifying their aircraft.
No aircraft modifications
Optimized flight path built from your pipeline or transmission line data
Real-time and post-flight route tracking
Every survey saved to the database
Visual
Aerial patrol with near real-time reporting
Everything in Navigation, plus a reporting system and handheld camera. Your crew reports what they see, and every observation is tagged with GPS coordinates as it is recorded.
Best for operators running regular right-of-way patrols on any corridor, who do not want to modify their aircraft.
No aircraft modifications
Reports sent from the aircraft during the flight
Flight track and coverage with date and time stamps
Every survey saved to the database
Imaging
Geo-referenced corridor documentation
Everything in Visual, plus a camera system that captures the corridor on its own. Every image is tagged with GPS and INS data.
Best for pipeline and electric transmission operators who want to compare the same stretch of line from one survey to the next.
Small camera ports added to the aircraft
Geo-referenced high-resolution images and video
Vegetation and encroachment analysis
Structure counts and asset classification
Change detection between surveys
PLANNING
PATH
The route is built before anyone gets in the aircraft.
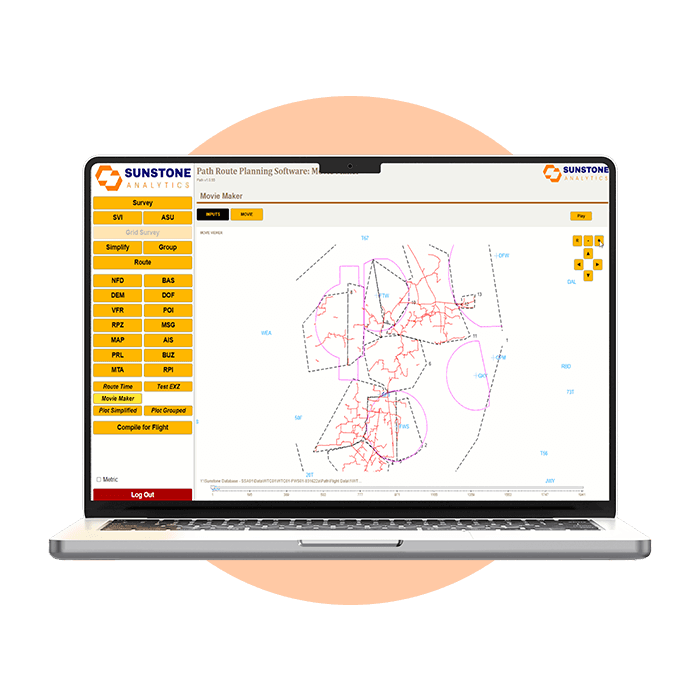
The PATH planning module takes your own SHP, CAD, KML or KMZ data and builds an optimized route against safety datasets from the FAA, USGS, FERC, and DOT, along with your reporting parameters.
See airspace restrictions, obstructions, and asset conflicts during planning, before the aircraft leaves the ground.
Get a secure flight file built to your exact reporting parameters, ready before the aircraft leaves the ground.
~20% less flight time
A five-state survey system went from 70-74 hours down to 56-59, after the route was planned in PATH.

OPERATIONS
SCHEDULE
The flight gets checked before it’s booked.
SCHEDULE holds personnel and roles, pilot currency and medicals, survey scheduling, aircraft maintenance, fuel and oil consumption, and expenses. It also controls who can reach every other module.
A maintenance item out of compliance surfaces when the survey is scheduled, not on the morning of the flight.
Fuel and oil trending gives early warning on an engine, and access to the whole system is managed in one place.

IN THE COCKPIT
FLIGHT
Configurable screens, sunlight-readable displays, eyes outside.
FLIGHT software is configurable for single or dual flight crew modes of operation to assist with Crew Resource Management (CRM), giving the pilot, the operator, and the ground-side administrator each their own display.
The pilot sees what is needed to fly the line. The operator sees the sensing and reporting detail.
GPS/INS reports where the sensor was pointed, not where the aircraft was, so the position in the record is the position on the ground.
TRACKING & GIS EXPORT
FOLLOWING
Watch the survey happen, then take the imagery into your own GIS.
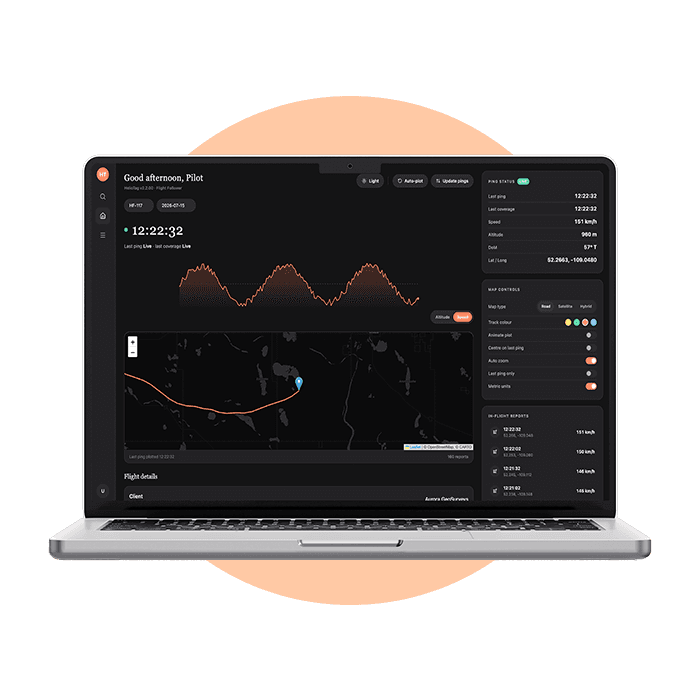
FOLLOWING tracks the aircraft in near real time while the survey is underway. WORLDFILES converts the imagery into Esri world files.
With the tracking add-on, you can see where the aircraft is at any point along the corridor.
Imagery drops straight into the GIS your team already runs, in a format it already reads.

IN THE FIELD
FORMS
The paperwork happens in the field, not back at the desk.
FORMS captures fuel, expenses, maintenance squawks and logbook entries from the field on a phone, and writes them straight into SCHEDULE so you have the full picture.
Nothing gets re-entered when the crew gets back, and a squawk raised in the field is already in the maintenance record.
Costs land against the survey they belong to, so you know the margin on a job before the invoice goes out.
AFTER THE FLIGHT
PROCESS
Processing starts the day you fly, not the week after.
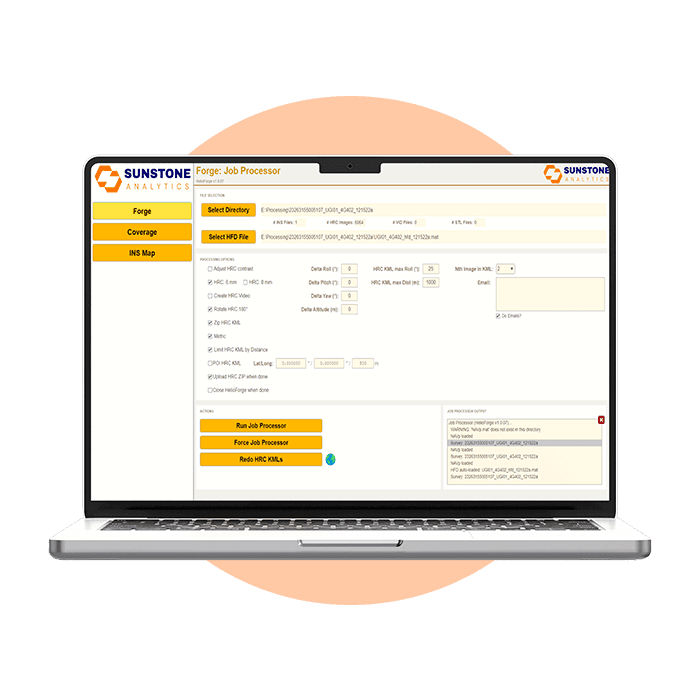
As soon as the flight crew backs up the day’s data, PROCESS turns the raw survey data into geo-referenced imagery and coverage maps, ready for analyst review.
No handoff to a separate processing vendor in the middle of the job.
Coverage maps show what was actually flown, so a gap in the corridor is found before anyone writes a report on it.
Point clouds rendered and delivered the next day, so your team can review survey results while they're still current.

THE DELIVERABLES
REPORT
A person reviews every survey before it reaches you.
REPORT puts processed imagery in front of an analyst, calculates the precise GPS location of an incursion and its distance from the asset, and carries annotation through to the finished client report.
An incursion arrives with coordinates and a distance from the line, not a photograph and a description.
Reports come out in your format, because Sunstone wrote the software that generates them.

THE RECORD
DATABASE
One auditable archive, instead of a dozen formats from a dozen vendors.
DATABASE is the client-facing system of record. Search your full survey and report history, look at trends across seasons, flag and annotate what matters to your team, and keep a defensible chain of evidence behind all of it.
This is what you have when someone asks you to prove what you covered.
Every survey carries the same record, no matter which provider flew it.